Friday, November 26, 2010

Windrose

A wind rose is a  tool used by meteorologist to give a detailed view of how wind speed and direction are typically dispersed over a particular location.

Climograph

A climograph is a graph representing the monthly precipitation and temperature conditions for a certain area.

Population profile

A population profile is a chart showing the number of people as a function of their ages.

Scatterplot

A scatter plot is used to tell the difference between two different variables.

Index Value Plot

An index value plot is a good way to show how close the values are too a fixed value.

Accumulative Line Graph

An accumulative line graph is a graph will all the values added up and plotted on a graph.

Wednesday, November 24, 2010

Bilateral graph

A Bilateral graph shows the increases on one side of a zero line and a decreases on the other side. Bilateral graphs are used to display data when there is both positive and negative values.

Nominal area choropleth map

 
Nominal area choropleth map is a type of choropleth map that is used to display nominal data. 

Unstandardized Choropleth Map

 
A standardized choropleth map does not have to be standardized to show data on a mapand it can use different colors to represent data.

Standardized Choropleth Map

A standardized choropleth map allows the comparison of distribution among different areas by the use of different colors. 

Univariate choropleth map

A Univariate choropleth map uses only one symbol to describe data on a map.

Bivariate Choropleth Map

A bivariate map displays two variables on a single map and it combines two different sets of symbols.

Unclassed Choropleth Map

Unclassified choropleth maps assigns shadings proportional to the data values so that these choropleth maps but in a unclassified choropleth map you do not have to classify the data.

Classed Choropleth Map

Classed Choropleth Map are a type of map that selected areas are shaded or colored to reflect that specific area.

Range graded proportional circle map

A range graded proportional circle map is a proportional circle map that describes the circles in by there ranges and data. 

Continuously variable proportional circle map

A continuously variable proportional circle map is a proportional circle map which utilizes circles to create point data. This relates the scales to the specific data. The circles are in proportion to the variable being measured. 

Tuesday, November 23, 2010

Digital Orthophoto Quadrangle

A DOQ is an aerial photograph in which  terrain relief and the tilt of the camera have been removed. It combines the characteristics of a photograph and puts them on a map.  
 

Digtial Elevation Model

A digital elevation model is a digital representation of ground s topography and of the terrain of a area.

Digital Line Map

A DLG map shows cartographic vector information of a certain area.

Digital Raster Graphics

 
A DRG map is a specific area of topo map it is more generalized of an area instead of a typicall topo map that covers a lot of area.

Isopleths

Isopleths is data that cannot be actually collected but it is collected all around the area we re trying to get data from.

Isopach

An isopach map shows the thickness of rock in a certain area this type of map is used a lot in oil exploration.

Isohyets

An isohyet is a map that shows the same amount of rainfallof a certain area on a weather map.

Isotachs

An isotach is a line connecting the same wind speed on a weather map.

Isobars


Isobars
Website
Isobars are lines of equal atmospheric pressure shown on a weather map and each line passes through a given pressure value.

Light Detection And Ranging

LIDAR is a type of remote sensing technology that measures certain properties of scattered light to find the range or other information of a certain target.

Doppler Radar

The purpose of a Doppler radar  is a special radar that sends out waves that hit a certain object and bounce back to give a better picture of that object they are most commonly used in the weather service.

Black and White Aerial Photo

The purpose of Black and white aerial photos is too have real pictures of an area but we use black and white as a filter to filter out certain forms of light so we have a better picture of an area.

Infrared Aerial Photo

The purpose of infrared aerial photos is to be able to have real pictures of a certain area this is a big part of remote sensing and now we have access to all these types of pictures becuase of the internet.

Cartographic Animations


The point of a cartographic animation is to visualize an event that would not be seen if the maps were viewed without having two maps put together.

Statistical Map

A Statistical map is a type of map that tells you about one certain group of data for an example a statistical map can tell you how many males live in each state.


Cartograms

This is a Cartogram Map it uses geometry or space of the map and it distorts in order to represent information of different variables. There are two main types of cartograms area and distance cartograms.

Thursday, November 18, 2010

Flow Map

A flow map shows the movement of objects from one location to another and it is a mix of a map and a flow chart.

Isoline Maps

Isoline maps are maps that show three dimensions on a two dimensional plane.  They show this by drawing circles within circles which show differing levels of altitude.

Tuesday, November 16, 2010

Proportional circle maps


Proportional circle maps display data in relation to the size of the circles it is good a showing a specific race of people in a certain area. 

Choropleth Maps

Choropleth Map are maps that only show one specific form of data and they used different colors to show this .

Dot Distribution Maps

 A Dot Map shows where objects are on a map by placeing dots there. They are really good at showing populations on a map becuase you can represent people with a dot.

Propaganda Map

A Propaganda Map is a form of communication that is directed at different groups of people. For example this map is one during World War II probably produced by the United States showing that if we do not stop Germany they will take over all of europe.

Thursday, November 11, 2010

Hypsometric Map

 
A Hyposmetric Map is a spin off of a Topographic Map. A Hyposmetric map just shows more details by using tint shading and batching.

PLSS Map

 
A PLSS Map Also know as the Public Land Survey System is used to divide public domain lands the PLSS is supposed to benefit the citizens of the United States so they can better understand where all of the public land is.

Cadastral Map

 A Cadastral Map shows land or property boundaries on a map. This type of map is most commonly used to show land ownership of an area.

Thematic Map

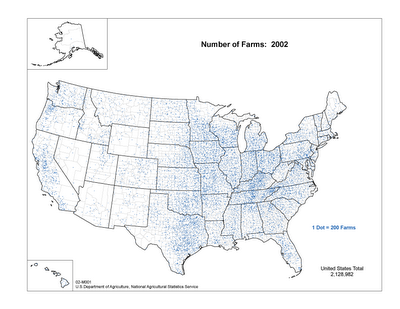
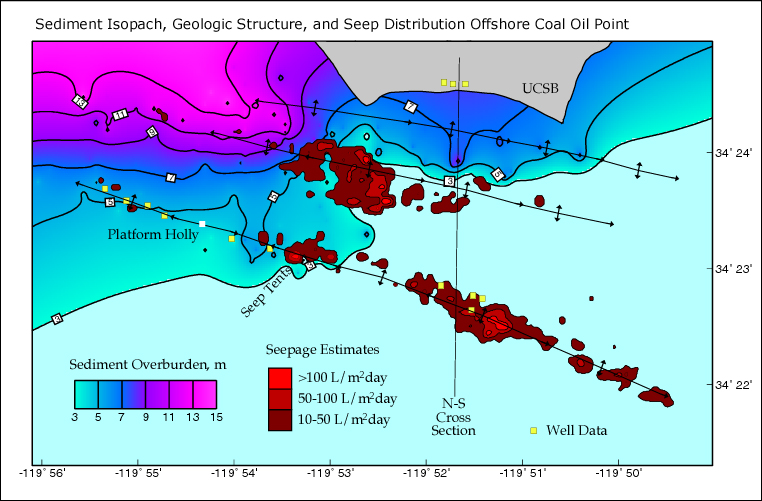
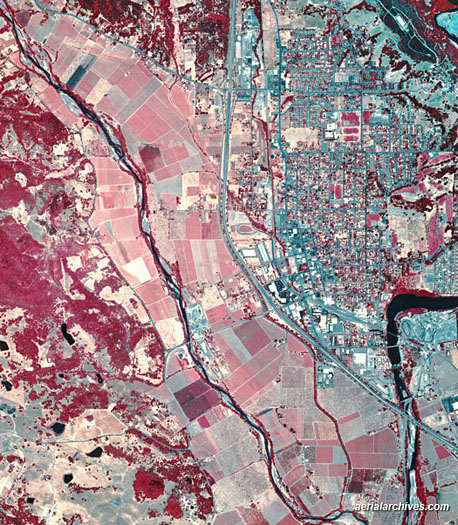
A Thematic Map is a type of map that shows a specific theme over a give area for example this map is showing the effects of a drought over the United States. Also a Thematic Map helps emergency management plan for a natural disaster because they can use this type of map to predict the extent of the damage to a region.

Topographic Map

Topographic Maps represent a three dimensional surface on a flat piece of paper. A topographic map really shows contours well and it gives you a good representation of what the land looks like.  

Planimetric Map

 
A Planimetric  Map is a map that shows only horizontal elements or features and it has no elevation features it is also know as a line map. This type of map is good for showing places and towns in a city because it shows the streets well.

Tuesday, November 9, 2010

Mental Map


This is a Mental Map I Mental Map is based off someones memory of what a place looks like. Mental Maps are the most common way for people to share information about a place that they know.